Fundraising by the Numbers: The 10 Metrics You Need to Know
Mar 10, 2023
These fundraising metrics give you a holistic picture into your fundraising efforts and help you make decisions and course-correct when needed. Consider these temperature checks into your fundraising landscape. The metrics below are specifically built for fundraisers -- not board members or leadership who are trying to measure the efficiency of the department. Many are deep, actionable metrics that people outside of fundraising might not know how to interpret or put into action.
You'll see that I didn't include total raised in my metrics. Although this is a critical metric, it is a given and I didn't want to use one of my ten precious spots.
How to Use These Metrics
All metrics need to be put into perspective. When crunching the metrics, I would urge you to look at the last full three fiscal years so you can see how this year is trending against the last couple. This will allow you to see increases, decreases, and stagnation of any of the measurements below.
Additionally, you'll want to look at all these metrics collectively as opposed to looking at them in siloes. For example, when you look at your retention rate, it is beneficial to understand the percentages of increased and decreased from retained donors. Are you retaining lower-level donors and/or high-level givers? It is also crucial to understand how long donors are retained. Is it 3 years or is it 10 years?
These metrics are not displayed in any particular order. They are all critical to understand your philanthropic landscape and will provide visibility into every element of your fundraising -- from annual giving to major gifts to planned giving.
If you need help building metrics and reports, click here.
Fundraising Metrics for Visibility into Your Development Program
Percentage of revenue from your top 10 donors
Pull a list of your top 10 donors (all donor types) and their cumulative giving for the last full fiscal year. Divide that by the total raised last fiscal year. This will give you the percentage of revenue from your top 10 donors. The goal is to land between 50 - 75%. If you are above 75%, you are top heavy and in a risky position. If you lose one donor, that will have a detrimental impact on your revenue and ultimately your mission delivery. If you are lower than 50%, you need to improve and expand your major gift efforts.
5+ consecutive year donors
We're looking for loyalty here and if you are inspiring your donors (at all levels) to stick with you for five or more years. Loyal donors are critical on so many fundraising fronts. The donors who stick with you during a pandemic and a recession, and when all is well in the world are the donors that are primed for graduating to the major gift level or leaving a bequest gift. Ideally, at least 10% of your donors have been with the organization for five or more consecutive years.
Retention & attrition rates
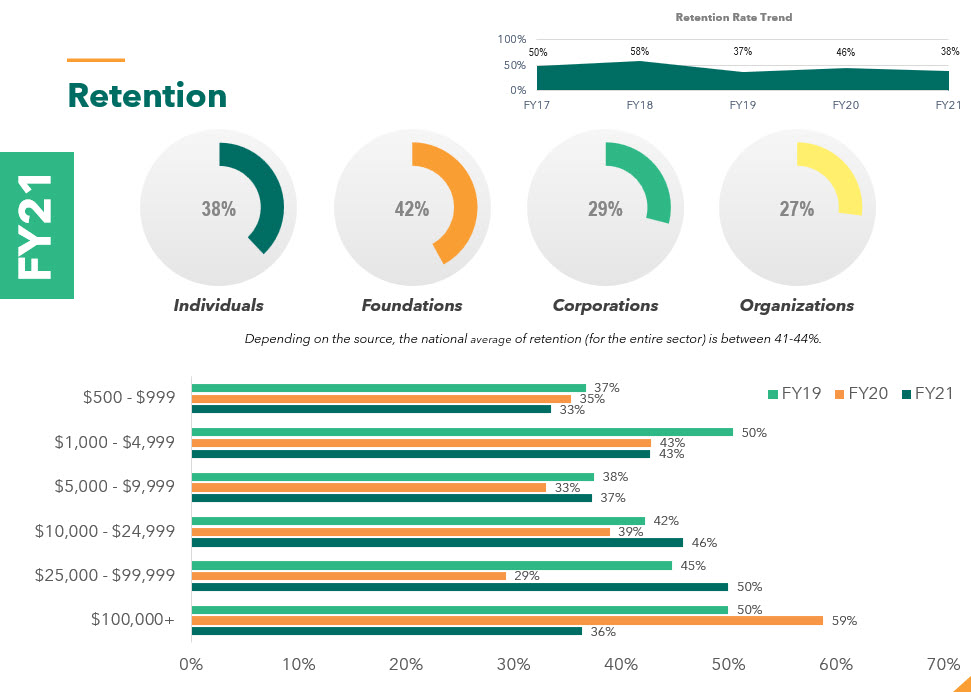
Retention is a systemic issue in the nonprofit community. Depending upon the source you reference, it teeters between 41-45%. To calculate retention, you divide the number of repeat donors this year by the total number of donors that donated last year. When you subtract your retention rate from 100%, that is the percentage of donors you lost from the previous year (attrition).
The perfect retention rate is between 70-85%. If you are above 90% retention, you have an acquisition issue and are not bringing on enough new donors. If you are below 70%, you are churning through donors at an alarming rate. If you want to take your retention metrics to the next level, you can look at retention by gift level and/or by donor type (see image below).
NOTE: When calculating retention, I recommend that you omit honor/memorial donors from the calculation as those are typically one-and-done donors.
Median gift from retained, recovered, and first-time donors
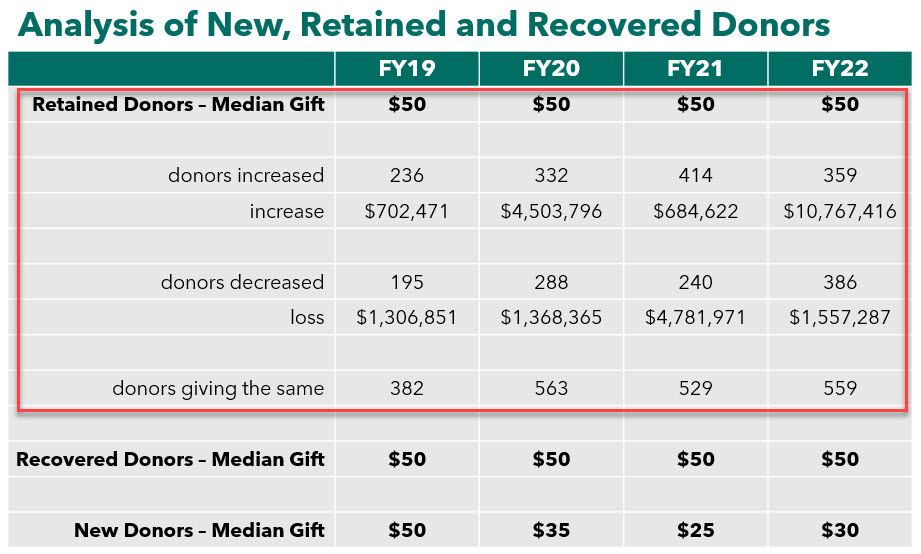
I prefer to look at the median gift as opposed to the average gift. Outliers on both ends of the spectrum will skew your average gift, so median is the logical choice. Every donor in the last full fiscal year will fall into one of three categories: 1) a first-time donor, 2) a retained donor from last year, or 3) a recovered donor (haven't given in 24+ months but came and gave). It is a sign of health that your first-time donors have the lowest median gift; your recovered donors' median gift is the second highest; and your retained donors have the highest median gift. If your first-time donors have a higher median gift than recovered and retained, you have a stewardship issue.
Board participation
The goal is 100% board participation. This sends a strong message to the community that your board believes in the mission and supports it. What's important here is the percentage, not necessarily the dollar amount. Your board is most likely comprised of people from all walks of life who have different philanthropic means. This is why we focus on the percentage because everyone is equally represented.
Upgrade/downgrade rates of retained donors
Retention rate is critical to understand, but let's dig a little deeper. Although donors are retained, are they upgrading, downgrading, or giving the same amount year over year? Below is the chart I like to use when looking at this data. You'll see that not only are we looking at the number of donors who increased and decreased, but we're examining the net gain and net loss. This information is powerful to see and then build strategy around mitigating retained donors who are decreasing their giving.
Size of the donor pool
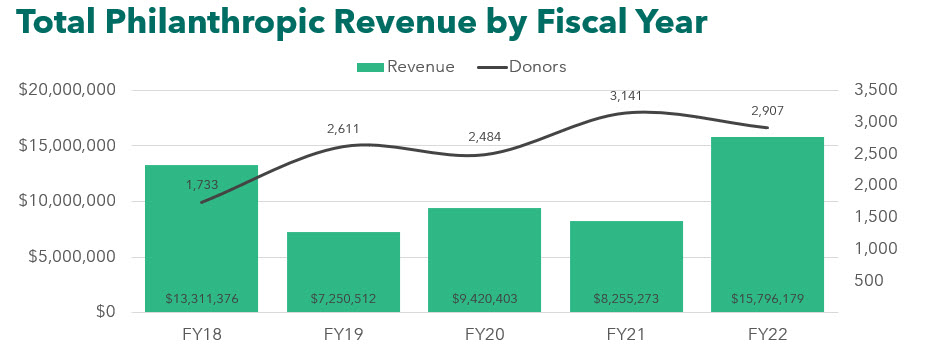
This is one of the most important metrics to examine as a fundraiser. Your donor pool and how it is changing over time gives you important insight into your pipeline and overall fundraising health. Ideally, you'll be growing your donor pool every year.
Distribution by gift level
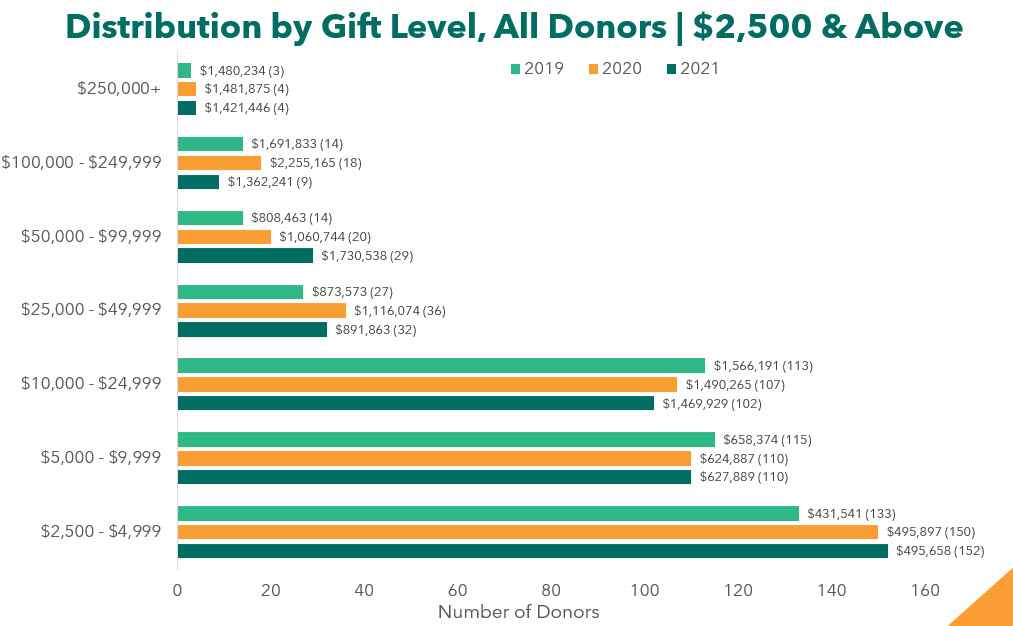
Another view into your philanthropy and how it's changing is to produce a chart like the one below. This is three full fiscal years and the number of donors at each level and the revenue from those donors. This lens allows you to see where this is growth and where there is loss. Look at the $50,000 - $99,999 level pictured below. Every fiscal year, this organization is inspiring more donors at this level.
Constituent mix at giving tiers
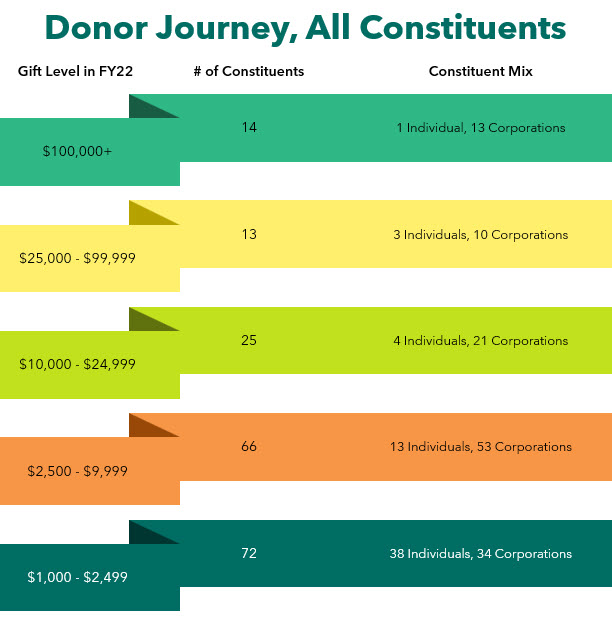
When you examine your giving levels (pictured on the left below), it is important to have a diverse group of donor types at every single level. Oftentimes, I see that institutional funders dominate the top rungs of the latter and individuals begin to be seen toward the middle of the image. In a perfect world, you would have representation from corporations, family foundations, and individuals at every level.
Return on Investment
Many organizations report out the cost to raise $1, which is a great metric. I've found that the inverse of that calculation gets a better reaction. By flipping the calculation, you calculate the development department's return on investment (ROI). If it costs you $.20 to raise $1, that also means that when you give development $1, the department brings you back $5. This is a much more compelling statistic! Board members and leadership understand this and it puts them in the right mindset of abundance (as opposed to scarcity with cost to raise $1). To calculate ROI, divide revenue by expenses.
There you have it! These are the fundraising metrics that I use when assessing development departments and building data-driven strategy. I hope these help you as much as they've helped me!
Want to chat with Mary about your major gift program? Schedule a game plan call to grow your major gifts and meet your goals!


